Surfaces designed
5
Question Builder, Explorer, Pinpoint AI, Insights, Industry Benchmarks. Built to compose.
Atlas Insights is the data product layer of AnyRoad's platform. Five composable surfaces (Question Builder, Explorer, Pinpoint AI, Insights, and Industry Benchmarks) turn raw guest data into operational understanding for the brand operator who has fifteen minutes on a Monday morning, not fifteen hours. This sub-page is the deep dive on each of those surfaces.
A brand-marketing director who needs to know what their guests actually think isn't a survey designer. They have a meeting in 20 minutes and they need to ship a question that returns useful data. Question Builder is the surface that gets them there.
The product treats questions as first-class objects in a library. Operators build a question once, name it, configure it, translate it, and reuse it across every experience the brand runs. Standardized question types (NPS, Marketing Opt-in, Purchase Behavior, Birthdate) come with industry-validated wording so the data they collect is comparable to peer benchmarks downstream. Custom questions cover everything else, with response formats sized to what the operator is actually asking.
The latest enhancement adds conditional logic on top of the library: sub-questions branching off a parent answer with an AND/OR composer for compound rules.
Before Explorer, customer data lived in a dashboard that returned everyone or no one. Slicing by repeat visitors, by NPS, by recency required engineering help or CSV exports. The operator's actual job, "show me first-time guests from California who scored 9 or 10," wasn't possible inside the product.
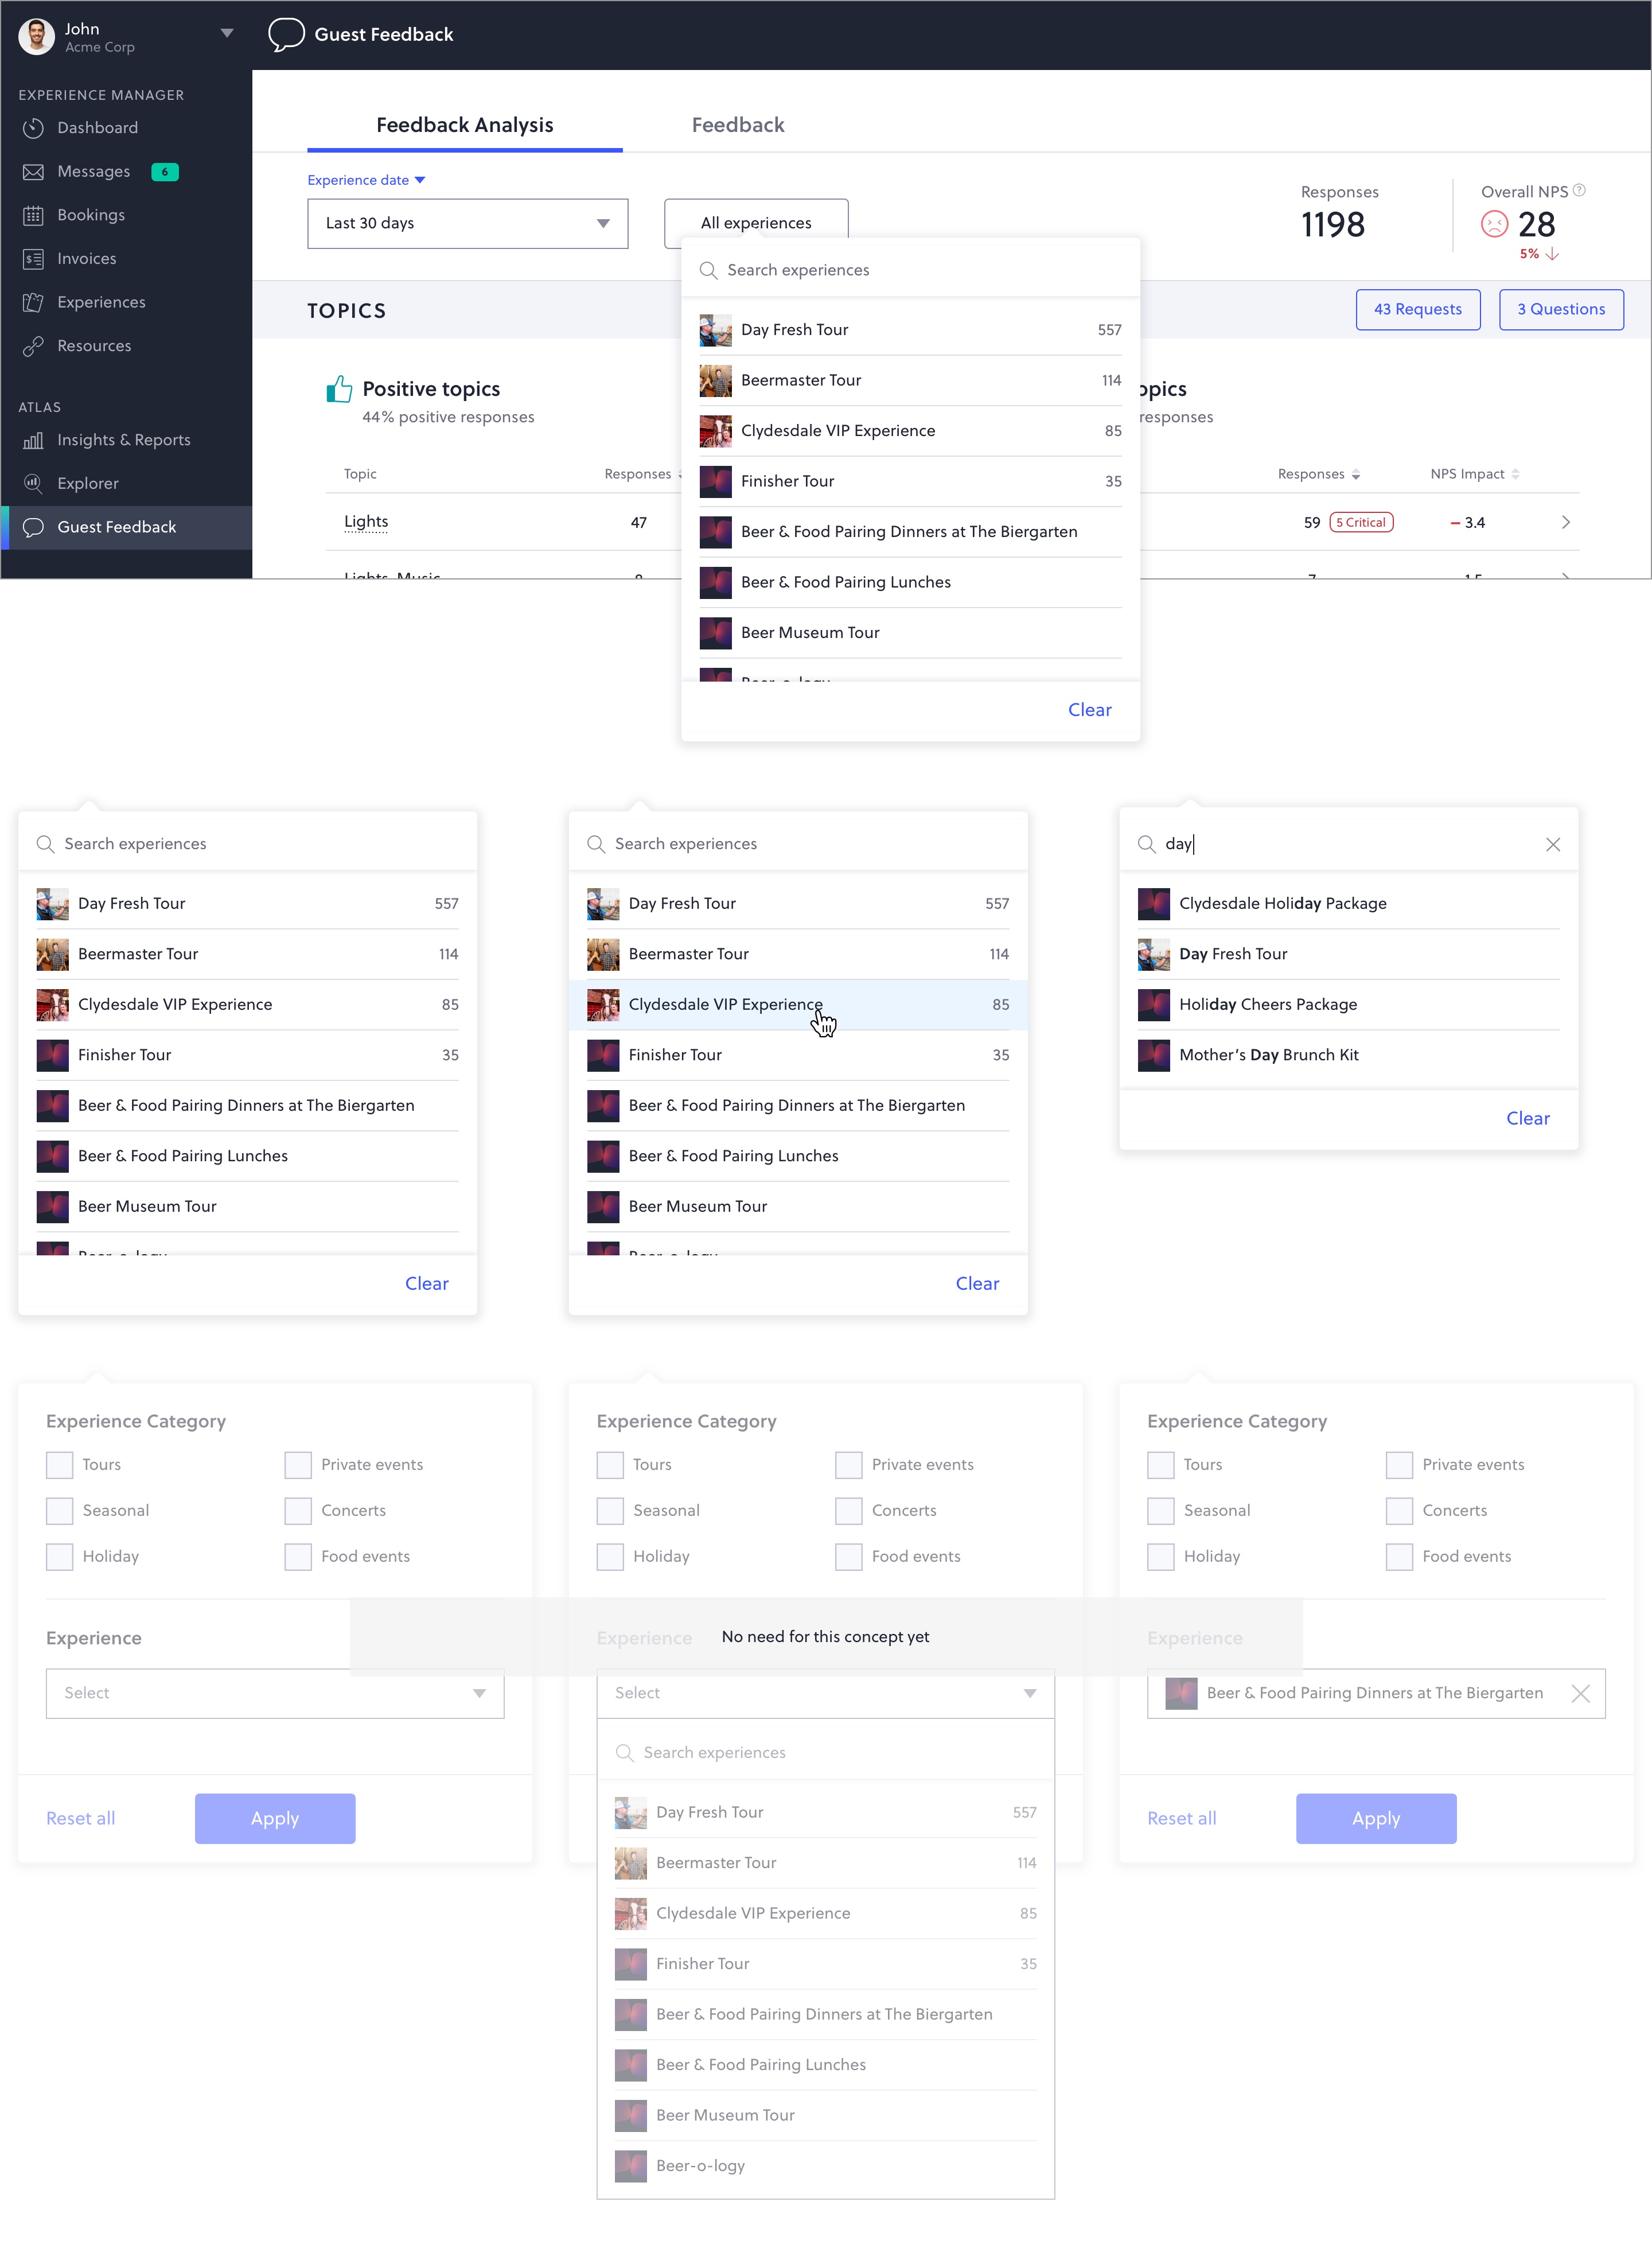
Explorer makes the customer object a real, queryable thing inside the platform. Operators build segments in the UI, save them, rename them, share them. A profile drawer surfaces every interaction the brand has had with a guest, and the segment primitive feeds every other surface.
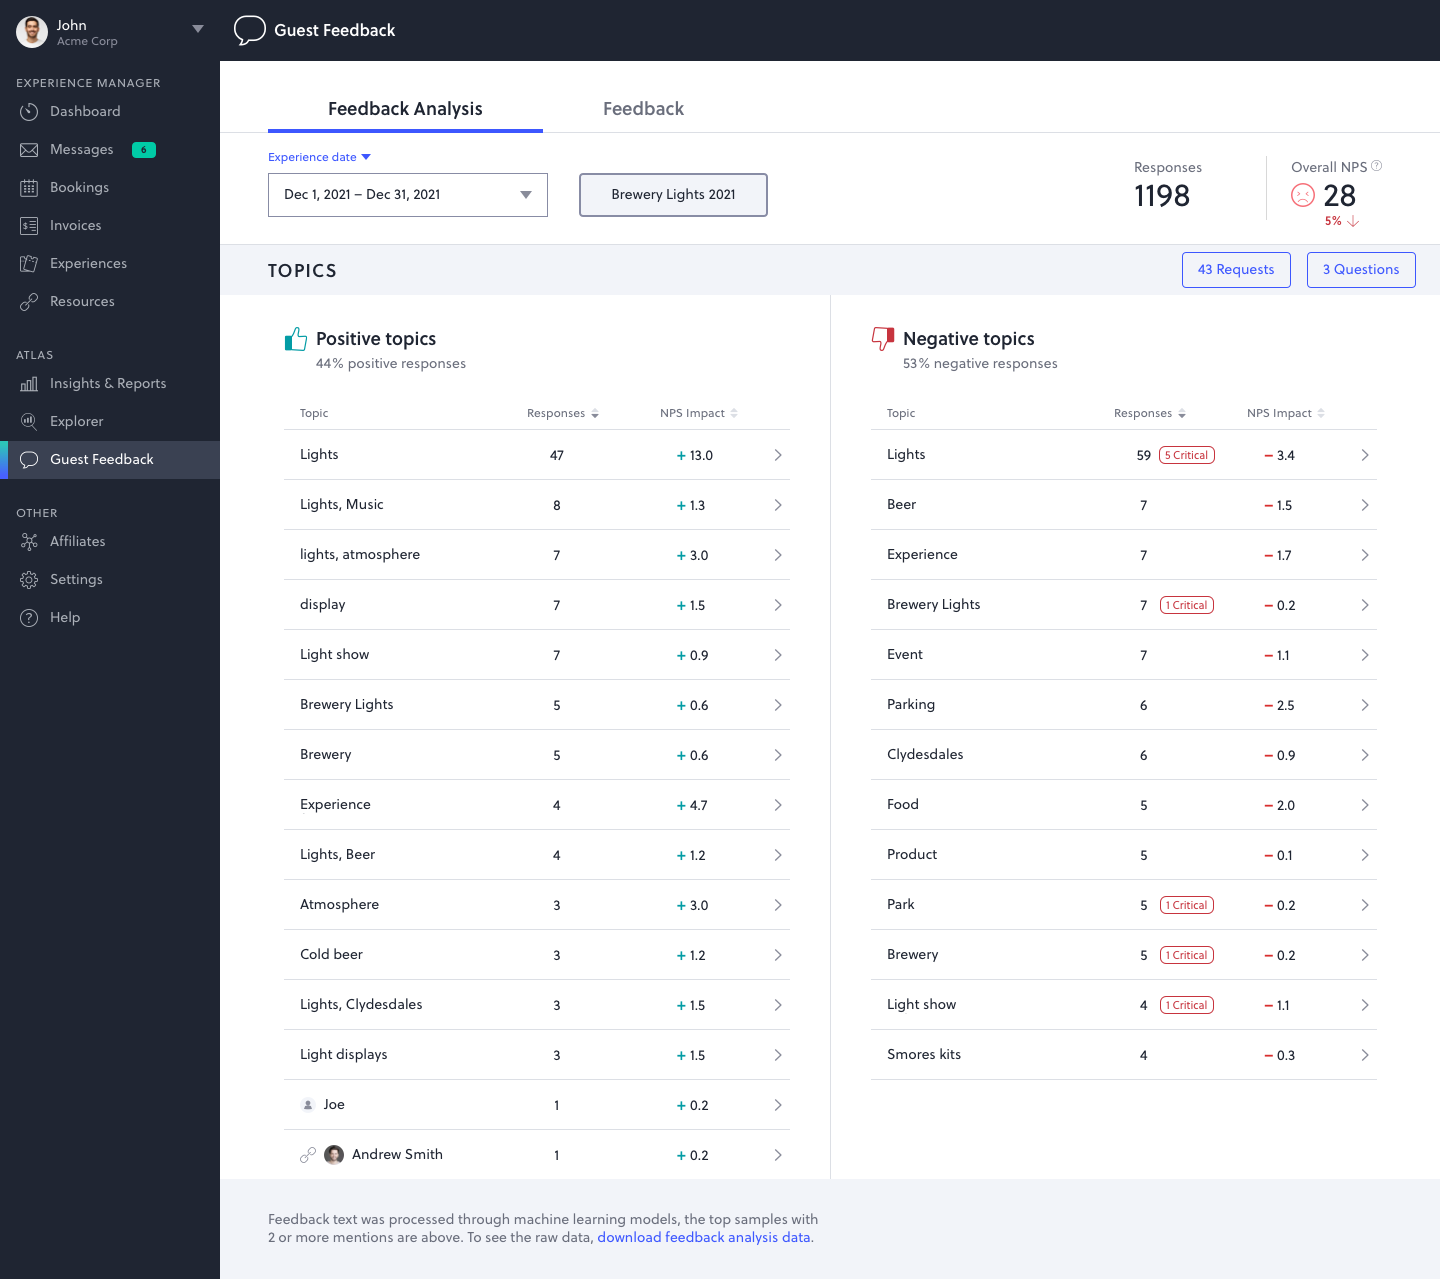
A single mid-sized brand could collect tens of thousands of free-text responses a year. Reading them was impossible. Tagging them was a part-time job. The hard part wasn't sentiment. It was knowing which topics were worth a meeting and which were noise.
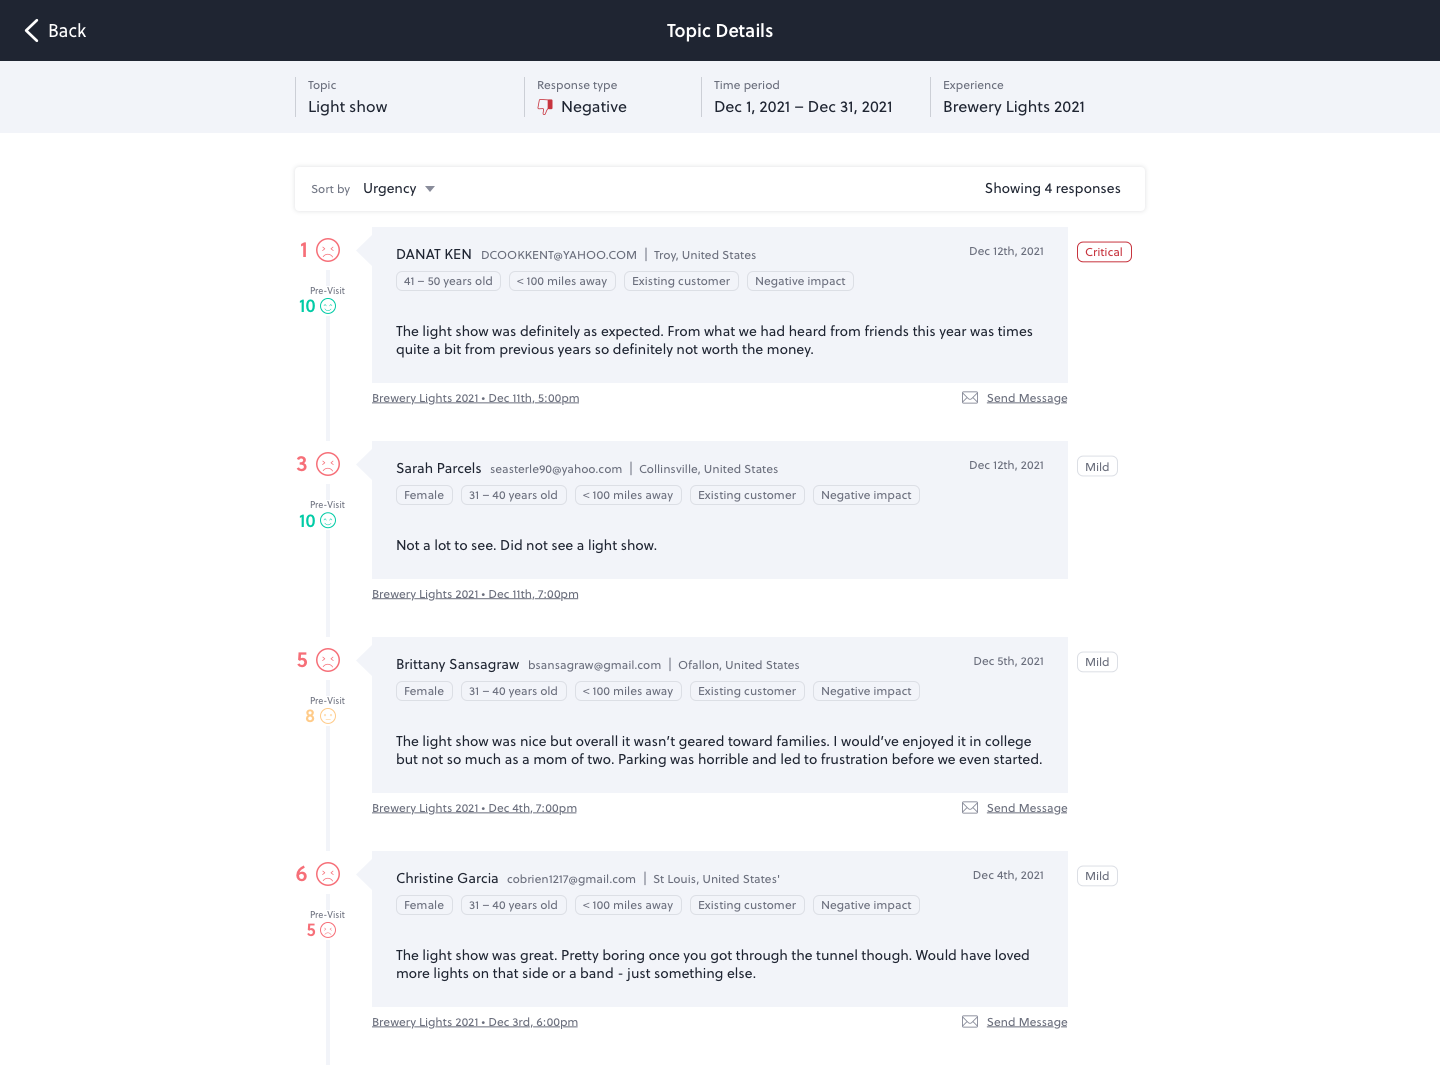
Pinpoint AI runs every response through a topic-clustering model and ranks the resulting topics by NPS impact, not just frequency. A topic in the negative column flagged "Critical" means it's not just complained about. It's measurably depressing the brand's score. Every topic is one click from the verbatims that drove it, with the full guest profile attached.
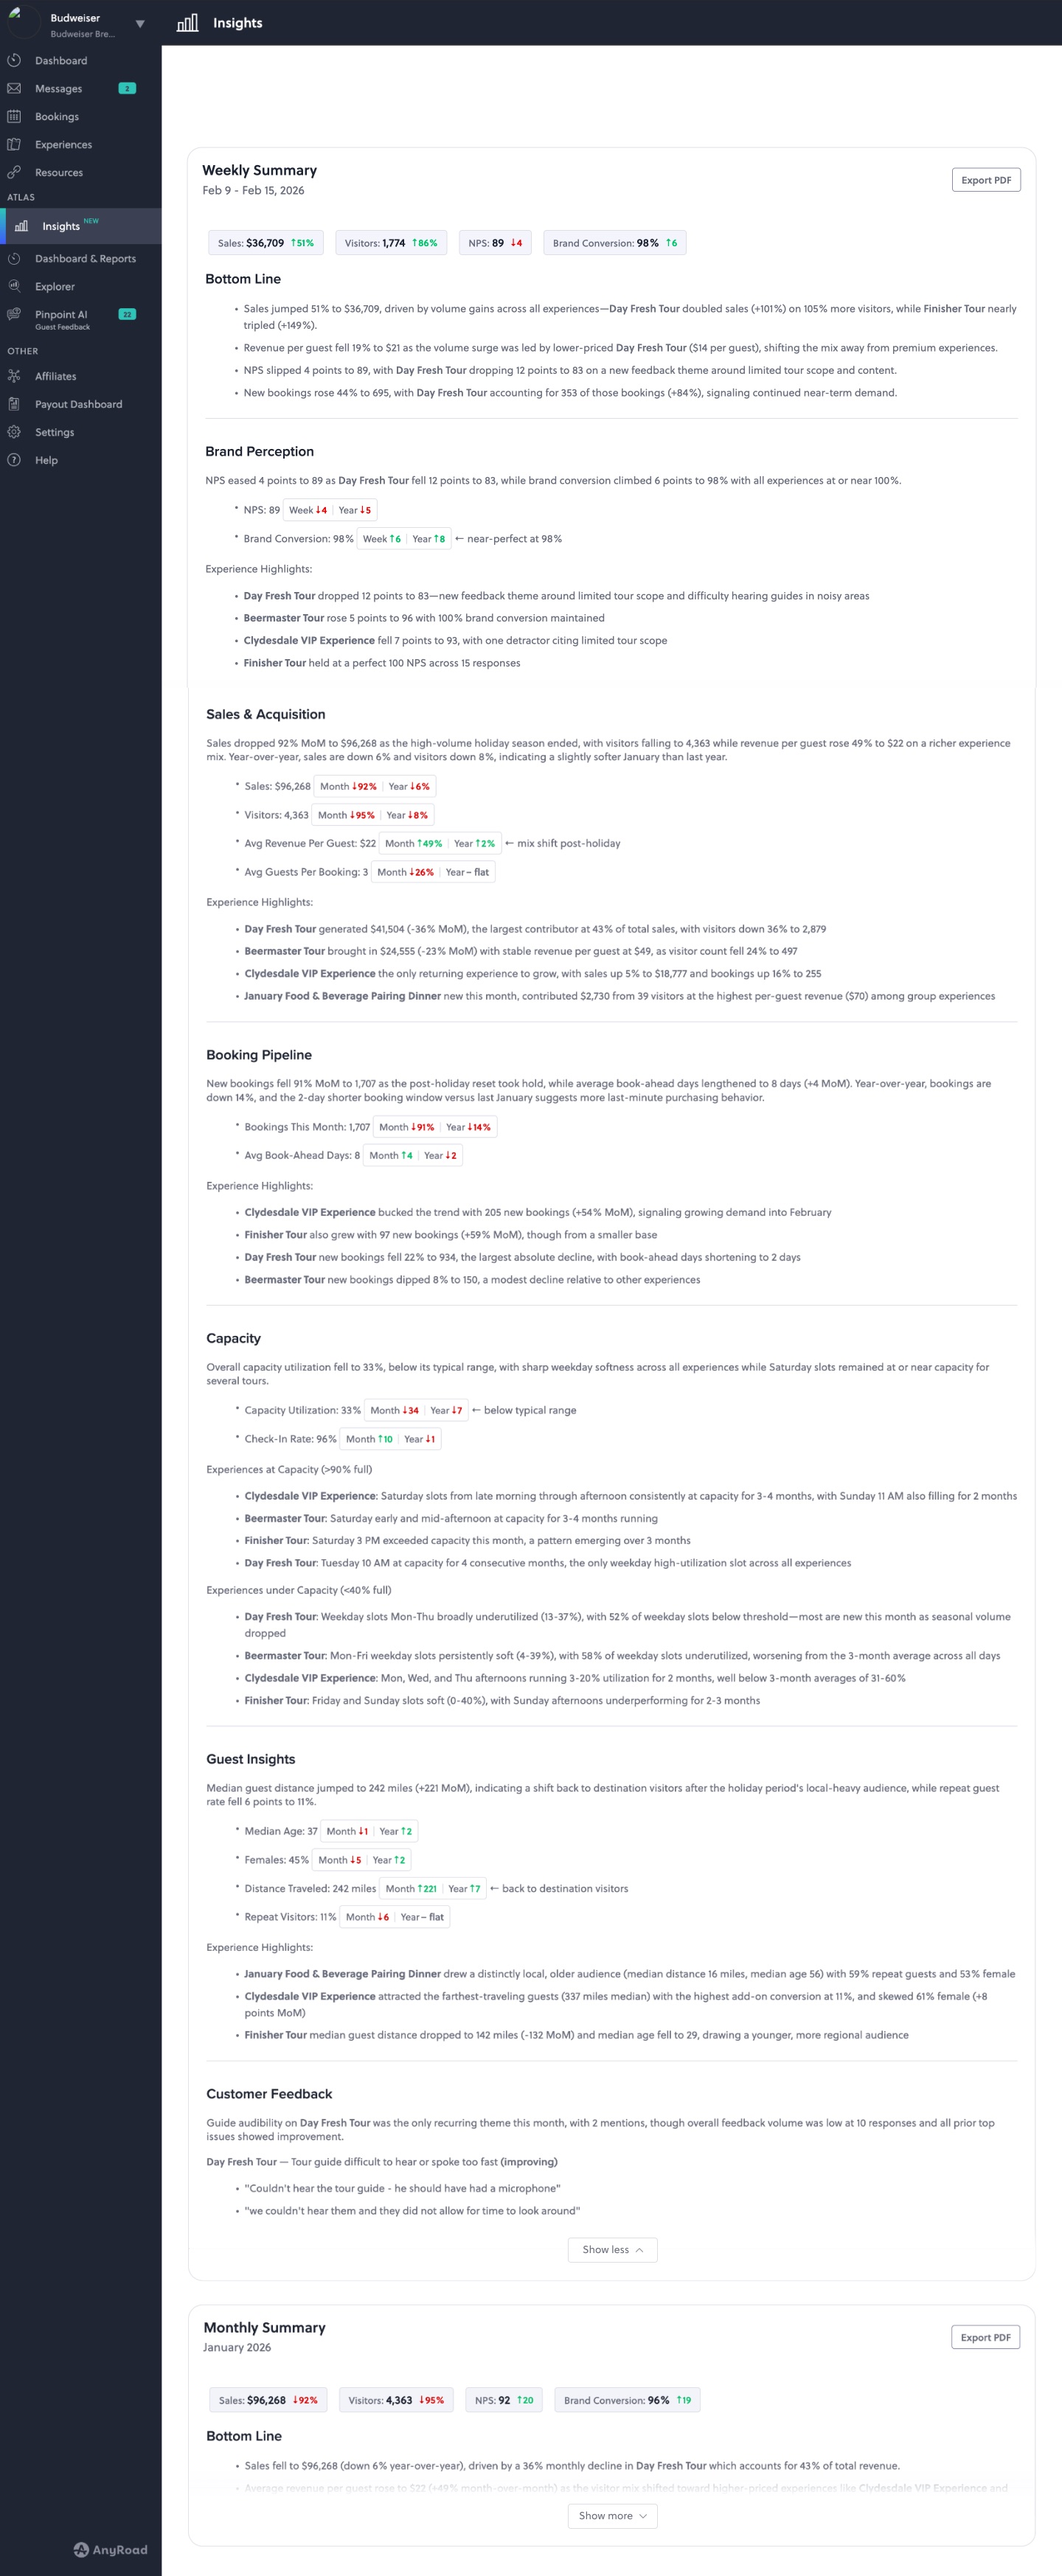
Even with the first three surfaces shipped, operators were still cobbling reports together by hand. They didn't want another dashboard. They wanted the email a smart analyst would write them on a Monday morning: what changed, why, where it shows up, and what's worth attention.
Insights generates exactly that. A weekly and monthly summary, sectioned by Bottom Line, Brand Perception, Sales & Acquisition, Booking Pipeline, Capacity, Guest Insights, and Customer Feedback. The narrative composes from Explorer's segments, Pinpoint's topics, and the underlying booking and revenue data, so a single document tells one story instead of six tabs telling fragments.
The four surfaces above let a brand understand themselves. Industry Benchmarks lets them understand themselves relative to peers. NPS, brand conversion, opt-in rate, revenue per visitor: every operator's first question is whether their number is good or just a number. Benchmarks answers it.
The surface overlays anonymized peer data on top of a brand's own metrics, sliced by industry, experience type, demographic, and season. A whisky distillery sees how their post-tour NPS compares to the alcohol category average. A CPG brand sees how their festival opt-in rate compares to the industry. The number stops being abstract and starts being directional.
The platform-design decision underneath Atlas was that the surfaces had to compose, not just coexist. A segment built in Explorer should slice Pinpoint. A topic surfaced in Pinpoint should appear inside Insights. A question authored in Question Builder should pre-populate the analysis surface the moment a response lands. Industry Benchmarks should overlay every metric without requiring a separate workflow.
That meant the surfaces couldn't be designed as separate features. They had to be designed against a shared mental model: the same customer, the same segment, the same experience taxonomy. And against a shared interaction grammar so an operator who learned one surface could read all of them.
— Atlas outcomes via AnyRoad's public Diageo case study · Platform-wide numbers on the parent case
Each of the five Atlas surfaces was a meaningful product on its own. But the value the operator actually felt was in the seams: the moment a Pinpoint topic appeared inside an Insights paragraph, or a segment built in Explorer pre-filtered Pinpoint, or a peer benchmark surfaced exactly where a number was being read. The work that mattered most rarely showed up in a single screen.
The temptation in enterprise analytics is to ship more dimensions, more filters, more configurability. Atlas went the other direction: each surface was sized to a specific question an operator already had on Monday morning. The value of constraint was that operators trusted the answers they got, because the answers were calibrated to their actual decisions.
Across five surfaces and several years of build, the question I kept returning to was the same: what does a brand-marketing director actually do on a Monday morning? Designing against that question pulled the team out of feature-by-feature thinking and into a workflow we could measure end to end.